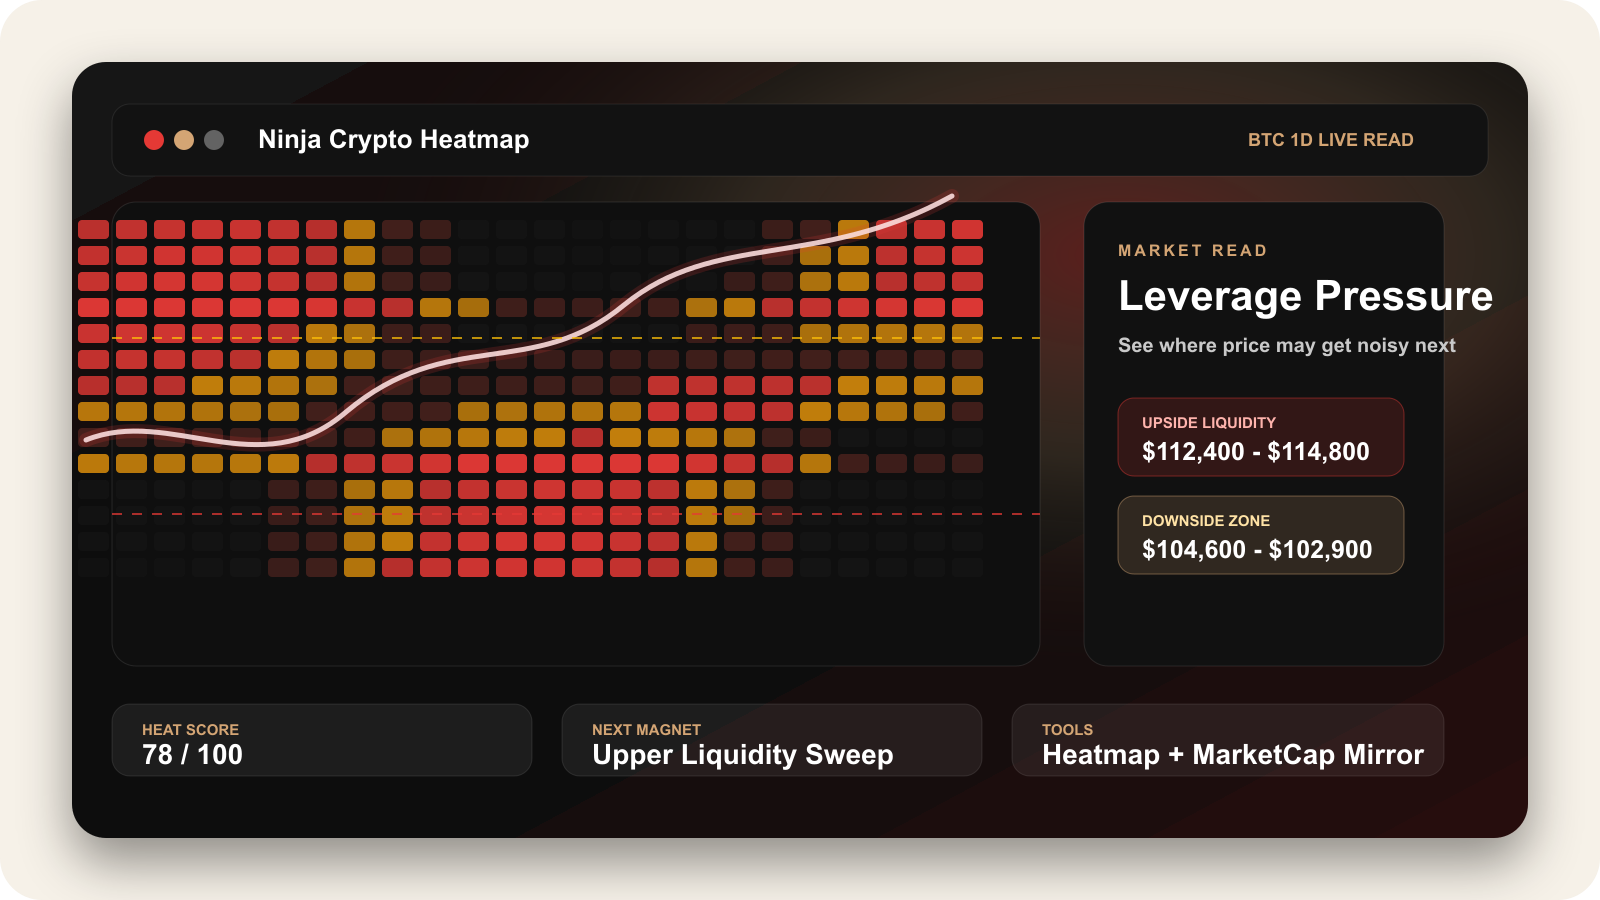
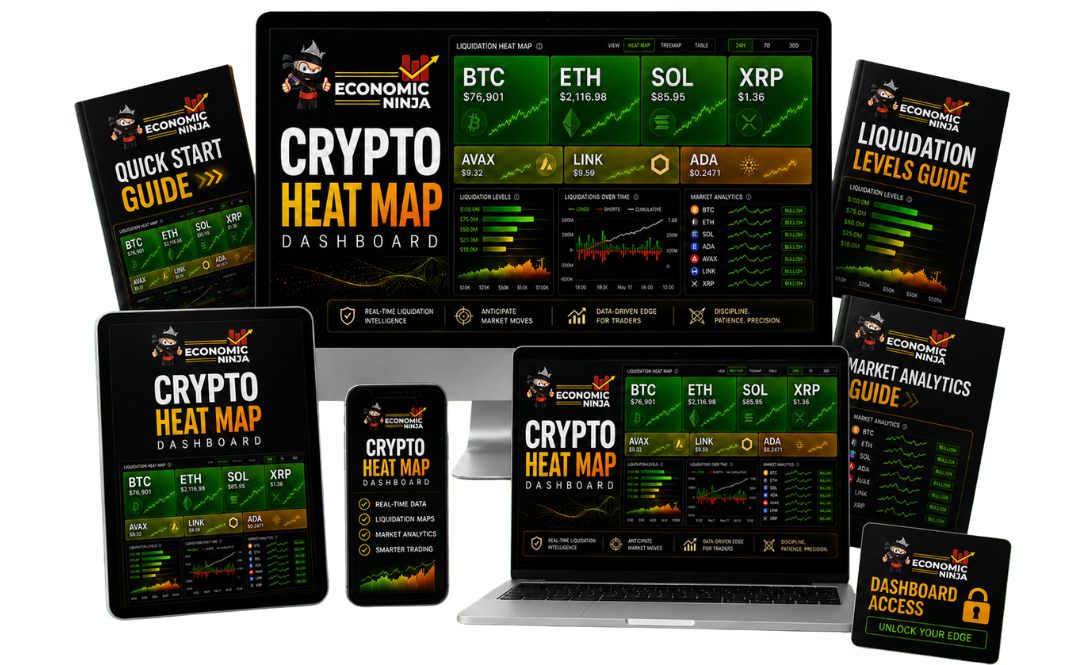
Student Sale Ends May 27 At 11:59 PM Pacific Time Left: Loading...
Special Tracker Student Offer

Add Heatmap Training To The Tracker You Already Use

You already have the Crypto Cycles Tracker. This adds the heatmap framework, liquidation-level training, and private dashboard access so you can study where market pressure may build next.

Ninja Crypto Heatmap digital product mockup
Claim Your Exclusive Tracker Student Offer
Special Student Path + Private Dashboard Access
44K+Economic Ninja Students
587K+YouTube Subscribers
86K+Newsletter Readers
The Problem

Most Crypto Traders Watch Price While Liquidity Builds Underneath It

Price is only the surface. The real action often happens around liquidity zones, leverage clusters, liquidation levels, and crowded positions.

That is why markets can rip higher when everyone is short, flush lower when everyone is overleveraged, or stall around levels that look invisible on a basic chart.

If you do not know how to read those zones, you are reacting after the move instead of understanding where pressure may build before the move.

That is what this course and dashboard are built to fix.

What You Get

Read Market Pressure Before It Becomes Obvious

01

Heatmap Dashboard

See estimated liquidity zones, heat intensity, key levels, leverage bands, and where price may get noisy next.

Crypto heatmap dashboard preview
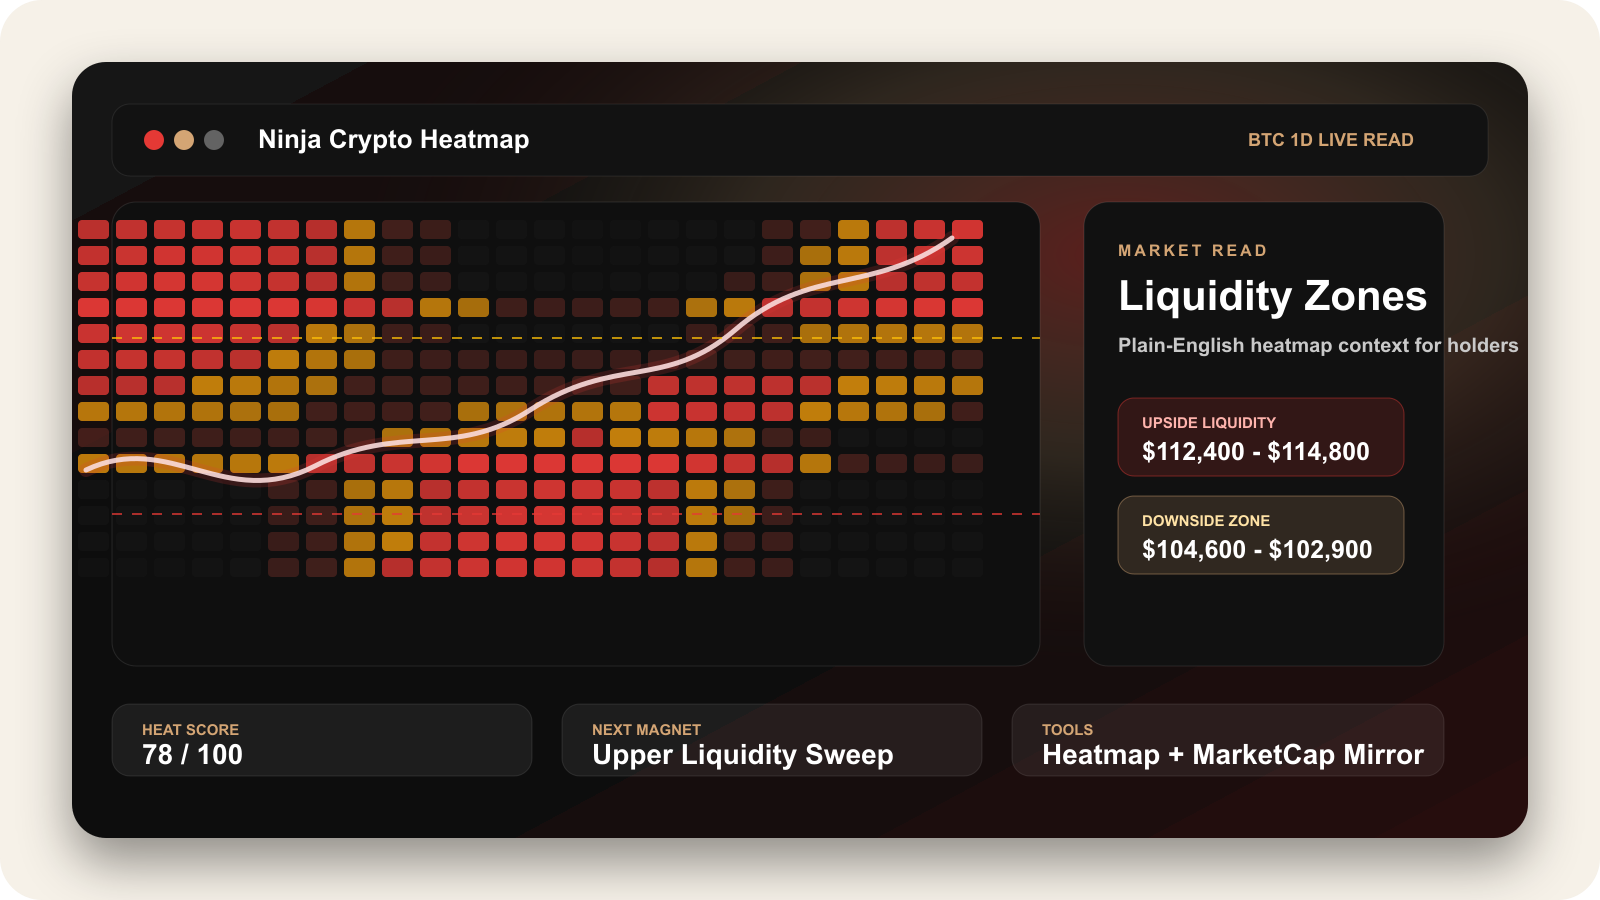
  • Heat zones show areas where pressure may be building above and below price.
  • Leverage bands help you study how 10x, 25x, and 50x pressure can cluster around market structure.
  • Timeframe controls let you compare short-term heat against broader context.
02

Liquidation Level Training

Learn how forced selling, forced buying, crowded leverage, and liquidity sweeps can shape crypto moves.

Leverage pressure dashboard preview
  • Liquidation basics so you know what the map is actually showing.
  • Liquidity magnets so you can recognize areas price may be drawn toward.
  • False-break context so you do not assume every breakout is clean.
03

Market Read Brief

Turn the dashboard into a plain-English read instead of forcing yourself to interpret every block manually.

  • Current price context for the selected crypto asset.
  • Upside and downside zones so you can see the next key areas faster.
  • What to watch next for calmer, cleaner market review.
04

MarketCap Mirror

Compare tokens by market cap so you can understand rough upside scenarios without doing the math by hand.

  • Token comparisons across major crypto assets.
  • Current and all-time-high scenarios for fast context.
  • Simple multiple estimates for educational market-cap modeling.
How You Use It

Three Steps To Turn Heatmap Data Into A Calmer Daily Market Read

1

Learn The Map

Start with the course so you understand liquidity zones, liquidation levels, leverage traps, and why price often moves toward crowded areas.

2

Open The Dashboard

Review heat zones, key levels, market pressure, and asset comparisons from one private dashboard.

3

Build Your Daily Market Read Strategy

Use the framework to identify what the market is showing, where traps may form, and what areas deserve attention.

Who This Is For

Buy This If...

  • You want to understand heat maps, liquidation zones, and leverage pressure without stitching together five tools.
  • You are a crypto student or holder who wants better market context before volatility hits.
  • You want a repeatable dashboard workflow for reading liquidity, market pressure, and key levels.
  • You understand this is education and market structure context, not a trade signal service.
Who This Is Not For

Skip This If...

  • You want guaranteed returns, exact buy/sell calls, or someone to manage your decisions.
  • You expect a magic indicator that removes risk from crypto markets.
  • You will not watch the training before using the dashboard.
  • You are looking for hype instead of a calmer way to study market pressure.
Why This Exists

Markets Move When Positioning Gets Forced

Most retail investors watch headlines and candle color. Professionals pay attention to where the pain is.

Where are traders overleveraged? Where could stops get swept? Where are obvious levels sitting? Where might a move accelerate because one side of the market gets forced out?

The Ninja Crypto Heatmap system gives students a cleaner way to study those questions without needing to stitch together five tools, a derivatives terminal, and a pile of guesses.

It is not financial advice. It is market structure education with a dashboard built to make the lesson easier to apply.

Economic Ninja 14-Day Money-Back Guarantee

Iron-Clad 14-Day Guarantee

Go through the training and test the dashboard. If you do not feel like it helps you understand heat maps, liquidity zones, and liquidation levels more clearly, email us within 14 days and we will refund your purchase.

Offer Stack

Here's Everything You're Getting Today

The tracker helps you read the cycle. This upgrade helps you study heat, pressure, liquidity zones, and liquidation context across major crypto assets.

Ninja Crypto Heatmap Tracker Upgrade

Course training, dashboard access, market read workflow, and future data upgrades.

Ninja Crypto Heatmap digital product mockup

Heatmap Course Training

Learn heat maps, liquidation levels, liquidity zones, leverage traps, and how to read noisy areas around price.

($197 value)

Private Heatmap Dashboard Access

Review estimated heat zones, market pressure, leverage bands, and key levels from one private dashboard.

($97 value)

Market Read Workflow

Use the plain-English read to understand upside magnets, downside zones, and what to watch next.

($97 value)

MarketCap Mirror Tool

Compare crypto assets by market-cap scenarios and understand rough price implications.

($97 value)

Future Data Upgrades

The dashboard infrastructure is built so deeper providers like CoinGlass can be connected as the product matures.

($297 value)
$785 Total Value
$9/Month
Claim Your Exclusive Tracker Student Offer
Tracker student sale access. Normally $97/month. 14-day money-back guarantee.
Secure Teachable checkout. Dashboard access unlocks with your course email.
Built By

Built By Ninja And Dylan For Crypto Students Who Want A Cleaner Market Read

Economic Ninja

Economic Ninja

Investor. Educator. Market Operator.

Ninja teaches market structure, cycle awareness, and risk-first thinking for investors who want to understand the game behind the headlines.

  • Active in crypto across multiple market cycles.
  • Trusted voice for no-BS crypto and macro education.
  • Built around helping students think before reacting.
Dylan Bradley

Dylan Bradley

Tech. Marketing. Automation.

Dylan built the dashboard infrastructure, auth flow, market-data adapter, and private access system that power the heatmap product.

  • Runs tech, marketing, and automation for Economic Ninja products.
  • Built the dashboard and Teachable access infrastructure.
  • Focused on turning complex market context into usable tools.
FAQ

Questions before you enroll.

Is this financial advice?

No. This is education and decision-support context. It does not tell you what to buy, sell, or hold.

Is this real liquidation data?

The current dashboard estimates heat and pressure zones using market data and market-structure logic. The infrastructure is built so professional derivatives feeds can be connected as the product matures.

Do I get the course and dashboard together?

Yes. The product is designed as training plus private dashboard access. The course teaches you how to read the tool, and the tool gives you a place to review the market.

How do I log into the dashboard?

Use the same email attached to your Teachable enrollment. The dashboard sends a secure magic link to that email.

What assets are supported?

The current dashboard focuses on major crypto assets including BTC, ETH, XRP, SOL, DOGE, ADA, LINK, and AVAX.

Can I use it on my phone?

Yes. The dashboard is responsive and works in a modern browser, although larger screens make heatmap review easier.

What happens as the dashboard improves?

Additional market-data providers and deeper derivatives context can be added over time. The page and product can be updated as those feeds go live.

Your Next Move

Start Reading Liquidity Before The Move

Get the training, use the dashboard, and build a cleaner read on where crypto market pressure may build next.

Ninja Crypto Heatmap digital product mockup

Student sale access ends May 27 at 11:59 PM Pacific.